
interconnection: stuck in line (part 1)
series on the interconnection queue! part 1: what is it?

In my last two series on generation and transmission, I dove into clean energy generation (sources include solar, wind, and hydro, as well as geothermal, biomass, and nuclear) and how we move energy through transmission (bottlenecks and how to fix them).
In this series I’m diving deeper into a key contributor to the transmission bottlenecks: the less visible, mysterious interconnection queue by which projects get approved to join the grid.
In part 1 I’ll explain what it is and how it works.
In part 2, I’ll cover what’s being done to fix it.
Welcome to part 1!
what is the interconnection queue?
The interconnection queue encompasses the set of procedures that new electricity generators must follow to connect to the grid to deliver energy to customers. It refers to the literal wait list of projects that are submitted to be approved.
Electric transmission system operators (ISOs, RTOs, or utilities) require projects seeking connection to undergo a series of impact studies.1 This is to assess potential impacts to the grid from the new generation before they can be built. Note:
Each regional grid has its own set of rules
The process establishes what new transmission equipment or upgrades may be needed before a project can connect to the system and assigns the costs of that equipment
what are the regional grids?

The US grid is divided into 10 transmission regions (see above.) Many of these are managed by seven ISOs (independent system operator) and RTOs (regional transmission organization).
ISOs and RTOs are nonprofit grid operators that oversee transmission systems in their regions. They ensure non-discriminatory access to the transmission grid by both customers and suppliers, obtaining electricity from generation suppliers, but they do not own any equipment themselves - these are typically owned by utilities.
The main differences between the two are the size of regions they operate and how they price services. RTOs cover larger, multi-state regions (e.g., MISO) whereas ISOs operate within a single state or smaller regions (e.g., CAISO, NYISO).
ISOs include:
CAISO, the California ISO
The Electric Reliability Council of Texas (ERCOT) is also an ISO, though it does not fall under the purview of FERC.
RTOs include:
Southwest Power Pool (SPP) covers Arkansas, Iowa, Kansas, Louisiana, Minnesota, Missouri, Montana, Nebraska, New Mexico, North Dakota, Oklahoma, South Dakota, Texas, and Wyoming
PJM covers 13 states and DC: Pennsylvania, New Jersey, Maryland, Delaware, Ohio, Michigan, Illinois, Indiana, Virginia, West Virginia, North Carolina, Kentucky, and a small portion of Tennessee. PJM also manages the wholesale electricity markets in these areas.
About 2/3 of US electricity load is served in ISO and RTO regions, according to FERC.2 There are also non-ISO utilities are electric utilities that do not operate under the umbrella of an ISO or RTO. They typically operate in regions where ISOs or RTOs are not present, and they manage the transmission grid and wholesale power markets themselves. The Southeast, Southwest, and Northwest all have wholesale electricity markets.
how do you submit a project to interconnection?
As power developers start the process of new generation projects, they must submit an interconnection request to the ISO to join the queue. This includes the following steps:
Submit a detailed application
Data and documentation surrounding the project such as project type, fuel type, net megawatt, location, operating data, synchronization date, point of interconnection, system impact study, builders, suppliers and more.
Place a financial deposit
Demonstrate the project is likely to secure land-use agreements for the project location, AKA "site control"
Ensure the project meets the ISO’s reliability, safety and facility standards, etc.
what are impact studies and why are they done?
Impact studies are all required for projects entering the queue. They aim to accomplish three goals:
Ensure grid reliability (so new generation doesn't cause outages or voltage instability)
Ensure deliverability (that energy can reach customers)
Ensure fair cost allocation (they want to make sure developers fund grid upgrades that their projects require because otherwise, it would land on ratepayers)
To get more specific, there are three main types of impact studies:
Feasibility study: The cost and impact a new project would have on the system (whether plugging the project into the grid will cause electrical problems / assesses transmission upgrade needs)
System impact study: An engineer evaluation of the point of interconnection, requiring more detailed info from the developer. The project's design can still change at this stage.
Facilities study: Estimates in greater detail the costs of equipment, engineering, and construction of facilities needed (wires + substation upgrades), to connect. the design is pretty set at this stage
Other possible studies:
Optional interconnection study: The odds of other projects in the queue being withdrawn.
Affected system study: happens when interconnecting a new project causes impacts beyond the local transmission system and into an adjacent system, which could have effects on other utilities or grid operators' systems
why are they so slow?
There are 5 primary reasons why the queue is so slow:
Study Requirements: Grid operators must study whether a new project could cause grid instability or require expensive infrastructure upgrades.
One-by-One Processing: Historically, projects were reviewed individually, on a "first-come, first-served" model. This is extremely slow and inefficient.
Restudies:
If a project drops out, the grid operator often needs to restudy impacts on remaining projects, adding more delays.
Studies also may need to be re-done if a proposed generator higher up in the queue decides to cancel their project and drop out of the queue, as it could change the impact and upgrade needs for other proposed generators.
Often times, projects will also reapply after revisiting the project layout or proposed tech, requiring an entirely new evaluation.
Speculative Projects: Developers submit many speculative projects, hoping some will work out. This clogs the system and forces operators to process a flood of possibly unserious proposals.
Stakeholder tensions:
Sometimes utilities, the transmission owners, and the developers, have competing interests. Transmission owners often lack the incentive to plan upgrades that would benefit independent developers rather than their own generation assets (RMI Report).
New generation also reduces revenue for existing generation sources. financial actors here are less incentivized to support new generation (Volts podcast).
why might a project drop out?
The main reason projects drop out is cost. Developers are often surprised by the high upgrade costs (funding a new substation or building a new line or upgrading an existing line) which they have to bear. Thus, the first project to trigger expensive upgrades may shoulder the full cost which they are disincentivized to do.
Delays in the studies can also prevent developers from being able to comply with construction permits.
say the studies are complete, what next?
If the studies are all completed, the interconnection customer (developer) then determines whether the upgrade costs are economical.
If yes, the customer and utility / grid operator sign the generator interconnection agreement, which is the plan for building the facilities and implementing upgrades. projects cannot interconnect until improvements are constructed.
what the queue looks like today
There are tremendous amounts of capacity waiting in the queue, and increasingly long wait times.
The amount of generation capacity entering queues each year has risen by more than 550% from 2015 to 2023. As of the end of 2023, 2,600 gigawatts of energy and storage capacity were waiting in interconnection queues. Solar, wind and battery storage projects account for 95% of active capacity in queues, with most of the remaining 5% being natural gas projects.3
Interconnection wait times are also growing. The typical duration from connection request to commercial operation has increased from <2 years for projects built in 2000-2007 to 4+ years for those built in 2018-2023, with a median of 5 years for projects built in 2023.
The below encompasses more than 11,000 energy projects.4
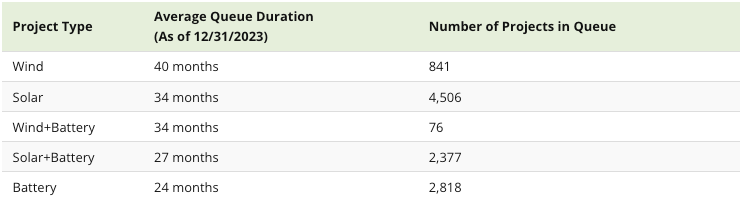
Solar and battery storage are by far the fastest growing resources in the queues. Combined, they account for over 80% of new capacity entering the queues in 2023. Over half of the battery storage capacity in queues is paired with a form of generation, mostly solar.
For comparison, proposed fossil fuel generation much lower, with 79 GW of natural gas and 1.5 GW of coal currently proposed.
Hybrid projects, which are multiple generation and/or storage projects that colocate, comprise a large and growing share of proposed projects, especially in CAISO and the non-ISO West. 571 GW of solar hybrids (primarily solar+battery) and 48 GW of wind hybrids are currently active in the queues.
However, most of this proposed capacity will not get built. Only 19% of projects (and 14% of capacity) seeking connection from 2000 to 2018 have been built as of the end of 2023. This is because as established, most projects that apply for interconnection are ultimately withdrawn, and those that are built are taking longer on average to complete the required studies and become operational.
what is to be done?
The interconnection queue is a major choke point for the clean energy transition.
It’s beyond frustrating for developers who are working to bring clean energy online. This was validated through many conversations with my friends building utility-scale solar and storage - improvements in the interconnection process are sorely needed, and past attempts to modernize the technology have largely failed.
The consensus seems to be that regulatory changes are needed to drive real, meaningful change here, and the stakes are extremely high.
In part 2 I’ll look at some proposed reforms, technologies, and companies working to modernize this process.
https://emp.lbl.gov/queues#:~:text=Electric%20transmission%20system%20operators%20(ISOs,installed%20U.S.%20electric%20generating%20capacity.)
https://www.ferc.gov/electric-power-markets
https://emp.lbl.gov/queues
https://decarbonization.visualcapitalist.com/age-of-energy-projects-in-interconnection-queues-by-state/